Ch 7: CCSM Measures for Central Heating Plants
Central heating plants produce hot water, steam, or both, typically using either natural gas, coal or oil as fuel. Steam, hot water, or both are distributed to buildings for HVAC systems and other end uses, such as cooking, cleaning, sterilization and experiments. Figure 7-1 illustrates the major components in a steam boiler with a hot water converter and a hot water boiler. Boiler plant operation involves complex chemical, mechanical and control processes. Energy performance and operational reliability can be improved through numerous measures. However, the CCSM measures discussed in this chapter are limited to those that can be implemented by operating technicians, operating engineers and CCSM engineers.
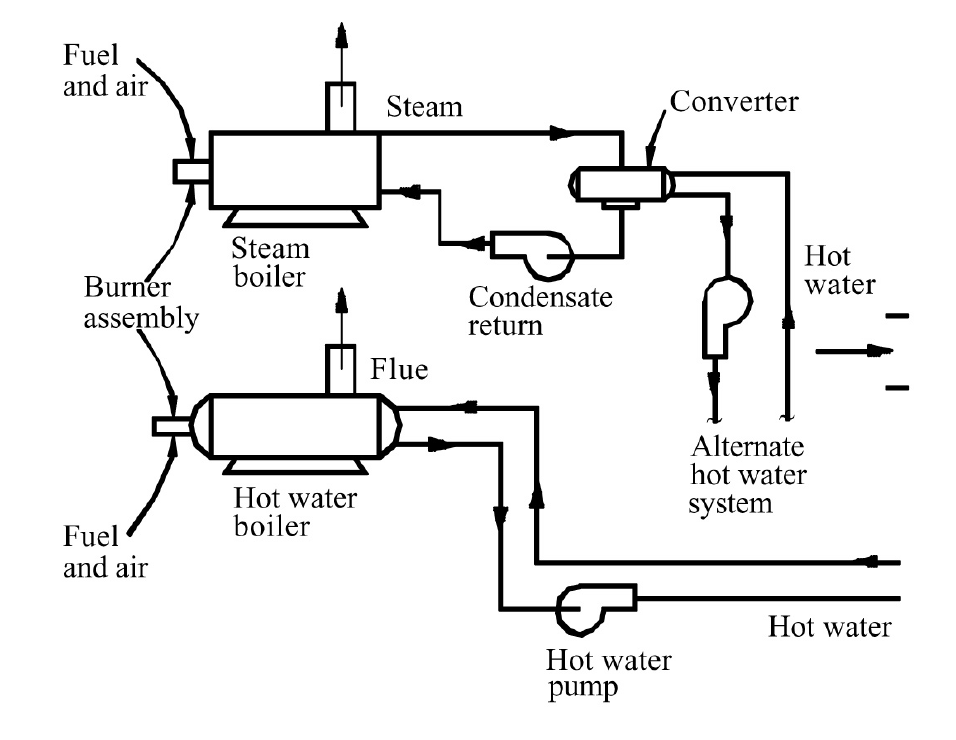
Figure 7-1. Steam and Hot Water Boilers
7.1 Optimize Supply Water Temperature and Steam Pressure
Steam pressure and hot water temperature are the most important safety parameters for a central heating plant. Reducing the boiler steam pressure and hot water temperature have numerous benefits including:
- Improved plant safety
- Increased boiler efficiency and decreased source energy consumption
- Increased condensate return from buildings and improved building automation system performance. Most condensate tanks are open to mechanical rooms. When the steam pressure is decreased, secondary evaporation is significantly decreased and mechanical room relative humidity level is decreased. This also improves the humidity level of the compressed air provided to the pneumatic systems.
- Reduced hot water and steam leakage through malfunctioning valves. For example, 5% hot water leakage at 180°F carries five times more energy into the space than the same amount of water at 90°F.
To identify and implement the optimal steam or hot water temperature set point, the following procedures should be followed:
- Interview personnel who use steam or hot water in applications such as cooking, cleaning and medical uses to identify the highest steam or hot water temperature requirement. For example, a typical medical building may have a steam pressure requirement of 40 psig. It is often supplied at 110 psig or higher. Pressure set point adjustment should be performed with care. For small boilers, adjustment can be performed by simply adjusting the thermostat. For large boilers, adjustment involves complex control system and hardware work. The equipment manual should be consulted.
- Identify the actual pressure loss through the pressure reducing valve (PRV). Some pressure loss is required to maintain stable operation. However, the pressure loss should be less than 10 psi.
- Ensure the plant steam pressure is the sum of the maximum required end use steam pressure and the steam loss of the distribution system. Likewise, the plant hot water temperature should be the sum of the maximum end use hot water temperature requirement and any temperature loss in the hot water loop.
- Implement the improved steam pressure and hot water temperature set point or reset schedules in the central heating plant
- Reset the hot water supply temperature and the steam pressure according to the ambient temperature, time of day, or other appropriate scheduling variable if building loads are the only requirement for the hot water or steam. The optimal temperature set point can be determined using a trial and error method. Reduce the hot water temperature until a cold call occurs or until the low temperature limit on the boiler is reached.
More information can be found in “Use of EMCS Recorded Data to Identify Potential Savings Due to Improved HVAC Operation and Maintenance” [Liu et al. 1997].
EXAMPLE:
A thermal energy central plant had two boilers that supply steam to the University of Texas Medical Center at Galveston (UTMB), a modern 3.5 million square-foot medical facility. The central plant provided steam at 150 psig during the summer and at 125 psig during the winter to the campus until CCSM engineers visited the campus in 1994. No one knew why the steam pressure was set at 150 psig during the summer and 125 psig during the winter. Questions about this practice received the response “This is the way we have always operated.” In facility operations, practices often are simply the result of history and operating tradition.
A field survey determined that the maximum steam requirement was 45 psig. The steam pressure was reset to 125 psig right after the steam pressure problem was identified.
Figure 7-2 shows the boiler efficiency and steam pressure in a time series plot. It shows that the boiler efficiency varies from 0.55 to 0.75 and the steam pressure varies from 125 psi to 145 psi. When the steam pressure is approximately 125 psi, the boiler efficiency is approximately 0.70. When the steam pressure is near 145 psi, the boiler efficiency drops to values generally in the range 0.60-0.66.
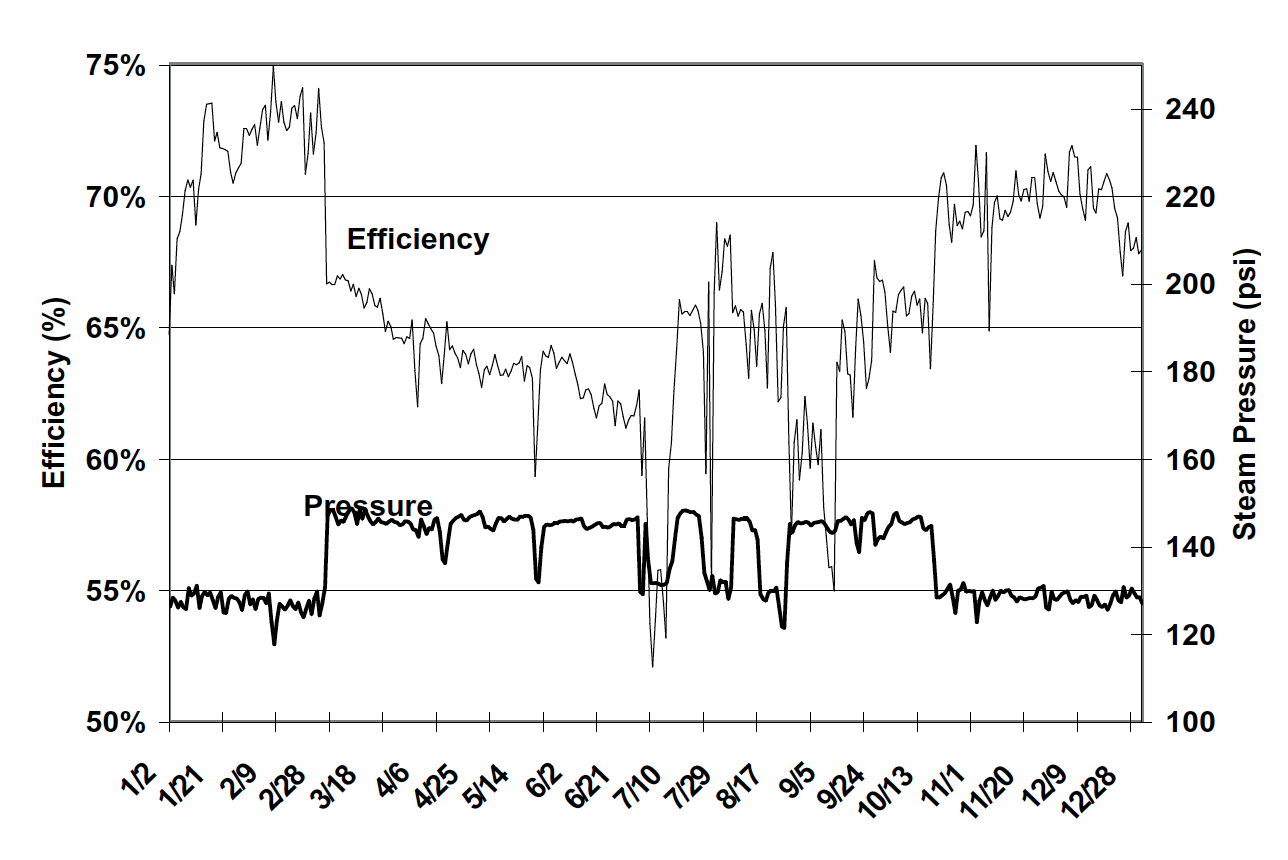
Figure 7-2. Boiler Efficiency and Steam Pressure at the UTMB Galveston Boiler Plant
Figure 7-3 shows the steam production and steam pressure as a time series. Relatively low steam production (about 32 MMBtu/hr) is observed in January 1994 and November and December 1993, when the boilers had relatively high efficiency. Clearly, the boilers can run at a high efficiency regardless of steam production if the steam pressure is at 125 psi.
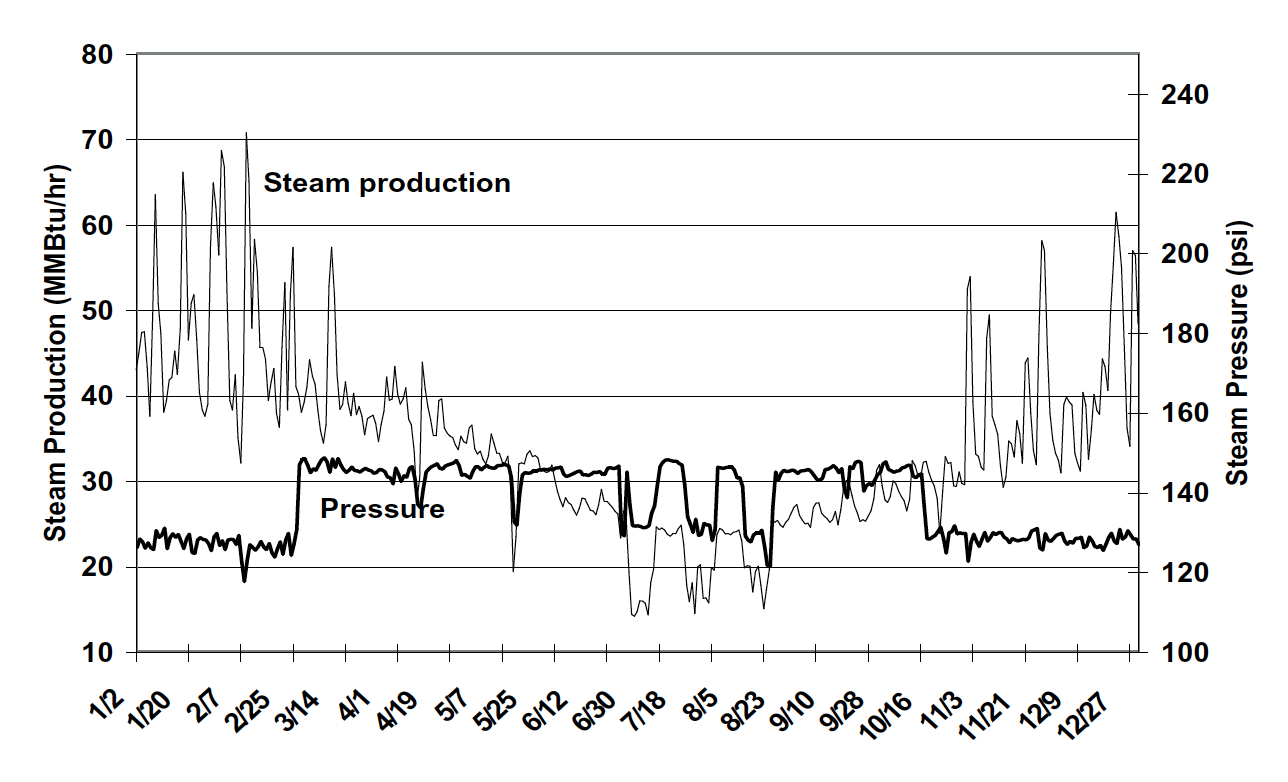
Figure 7-3. Variation of Steam Consumption and Boiler Pressure with Time at UTMB
Based on these observations, it is assumed that the boilers would have an average annual efficiency of 0.72 if operated at 125 psi which is the measured average efficiency in January 1994.
Table 7-1 presents actual annual steam production, gas consumption and boiler efficiency. The boilers produced 301,274 MMBtu/yr of steam with a total gas consumption of 437,563 MCF/yr from April 1, 1993, to March 30, 1994. The annual average boiler efficiency was 0.67. If the boiler efficiency is increased to 0.72 by setting steam pressure to 125 psi, the fuel required by the boilers would drop to 405,512 MCF/yr with the same steam production of 301,274 MMBtu/yr. Consequently, the potential annual gas savings were 32,051 MCF/yr, or 7% of the annual consumption. At a gas price of $2.57/MCF, the cost savings would be $82,000/yr.
| – | Steam | gas | Efficiency | Savings |
|---|---|---|---|---|
| – | MMBtu/yr | MCF/yr | % | |
| Current | 301,274 | 437,563 | 0.67 | |
| Improved | 301,274 | 405,512 | 0.72 | 7 |
Note: Actual energy savings are higher than $82,000/yr since the steam pressure was reset to 100 psig instead of 125 psig.
In 1995, the steam pressure was reset to 100 psig. In 1996, the operating staff tried to lower the steam pressure to 70 psig. However, the boiler shut down automatically because 70 psig was out of the controller range. Since 1996, the central plant has been providing steam pressure at 100 psig to the UTMB campus. The steam pressure reset improved plant safety and decreased gas consumption as well.
7.2 Optimize Feed Water Pump Operation
The feed water pump is sized based on boiler design pressure. Since most boilers operate below the design pressure, the feed water pump head is often significantly higher than required. This excessive pump head is often dropped across pressure reducing valves and manual valves. Installing a VSD on the feed water pump in these cases can decrease pump power consumption and improve control performance. The need for a VSD and the potential savings can be evaluated using the following procedures:
Inspect the pressure-reducing valve (PRV) on the steam supply pipe. Measure the steam pressure loss across the PRV. The pressure loss should be limited to the manufacturer’s recommended range. For a typical boiler, the pressure loss should be less than 20 psi. If the pressure is higher than the required value, adjust the PRV to reduce the pressure loss. Adjust boiler drum pressure set point.
Identify the potential pressure head reduction. Open all partially open manual valves on the feed water line. Measure the pressure loss across the control valve and the pressure-reducing valve. The potential pump head reduction is the difference between the measured pressure loss across the PRV and the required PRV pressure loss (often less than 10 psi).
Estimate the potential pump energy savings using annual steam/hot water production (G) and pump head reduction (Δh):
\[kWh = 0.0000512154 \frac{G (lbm / yr ) \Delta h (psi) }{ \eta }\]Install a VSD on the feed water pump and adjust VSD speed to maintain required boiler drum pressure.
Trimming the impeller or changing feed water pumps may also be feasible and the cost may be lower. However, the VSD provides more flexibility and can be adjusted to any level. Consequently, it maximizes the savings and can be adjusted to future changes as well.
EXAMPLE:
The thermal energy plant at UTMB Galveston, previously discussed, produced a total of 300,000,000 lbm of steam from April 1993 to March 1994. If the boiler steam pressure is decreased from 150 psi to 100 psi, the feedwater pump head reduction is 50 psi. The pump efficiency is approximately 0.8. If a VFD is installed on the feedwater pump, the annual pump power energy savings are 782 MWh. The savings are $39,000/yr at $0.05/kWh.
7.3 Optimize Airside Operation
The key issues are excessive air flow and flue gas temperature control. Some excess air flow is required to improve the combustion efficiency and avoid having insufficient combustion air during fluctuations in air flow. However, excessive air flow will consume more thermal energy since it must be heated from the outside air temperature to the flue gas temperature. The boiler efficiency decreases as excessive air flow increases. The flue gas temperature should be controlled properly. If the flue gas temperature is too low, acid condensation can occur in the flue. If the flue gas temperature is too high, it carries out too much thermal energy. The airside optimization starts with a combustion analysis, that determines the combustion efficiency based on the flue gas composition, flue gas temperature and fuel composition. The typical combustion efficiency should be higher than 80%. If the combustion efficiency is lower than this value, the following procedures can be used to determine the reasons:
- The flue gas temperature may be too high. Compare the measured flue gas temperature with the manufacturer’s suggested flue gas temperature. If the flue gas temperature is higher than the suggested value, reduce the set point (for a large boiler system).
- Excess air is too high. If the volumetric oxygen content of the flue gas is higher than 3%, or the excess air flow is higher than 20%, more air than needed is being supplied to the boiler. Reduce the air flow to the boiler. Caution must be taken for small boilers without air modulation devices. In these cases, the measurement should be conducted under full load conditions. Otherwise, an engineer must conduct a calculation to convert to full load excess air flow.
- For small boilers, airflow modulation systems are seldom installed. The air flow is often set based on full load requirements. However, heating loads are often significantly overestimated due to the current design methods and practices. Few heating boilers ever operate at full load or nearly full load. To decrease energy consumption in these boilers, the air flow should be set based on the actual maximum boiler load. Set the boiler load limit at this value. This can significantly reduce the boiler loss associated with excessive air flow.
- Reduce/eliminate air leakage in air economizers. If a boiler has an economizer or heat recovery unit to preheat the combustion air, be sure there is no leakage between the two air streams. In an economizer, the outside air has a positive pressure (up to 3 in. H2O) while the flue gas is under negative pressure. Outside air can easily leak through any physical cracks or holes as a result of the high pressure difference. When air bypasses the boiler directly to the flue gas, it causes high flue gas oxygen levels and low flue gas temperatures. Consequently, the control system may reduce air flow lower than required for complete combustion and produce dangerous CO. The combustion efficiency also decreases significantly.
More information can be found in “In-situ Calibration of Boiler Instrumentation Using Analytical Redundancy” [Wei et al. 2001].
EXAMPLE:
Boiler 9 in the central utility plant on the Texas A&M campus was installed in 1962 with a rated capacity of 175,000 lbs/hr. The electrically driven feed water pump has a capacity of 468 gpm (234,300 lbs/hr). The supply air fan has a capacity of 63,750 cfm. A VFD is used to control the fan speed to accommodate the load changes. The boiler is equipped with an air preheater to warm the combustion air using the flue gas. A superheater heats the steam after the steam leaves the drum (see Figure 7-4 for details).
Boiler 9 is equipped with extensive metering to measure the boiler production and evaluate the performance. The key parameters measured are boiler feedwater flow and temperature, steam pressure and temperature, steam production, natural gas consumption, air flow, flue gas temperature and O2 level. These data are recorded by a Westinghouse control system.
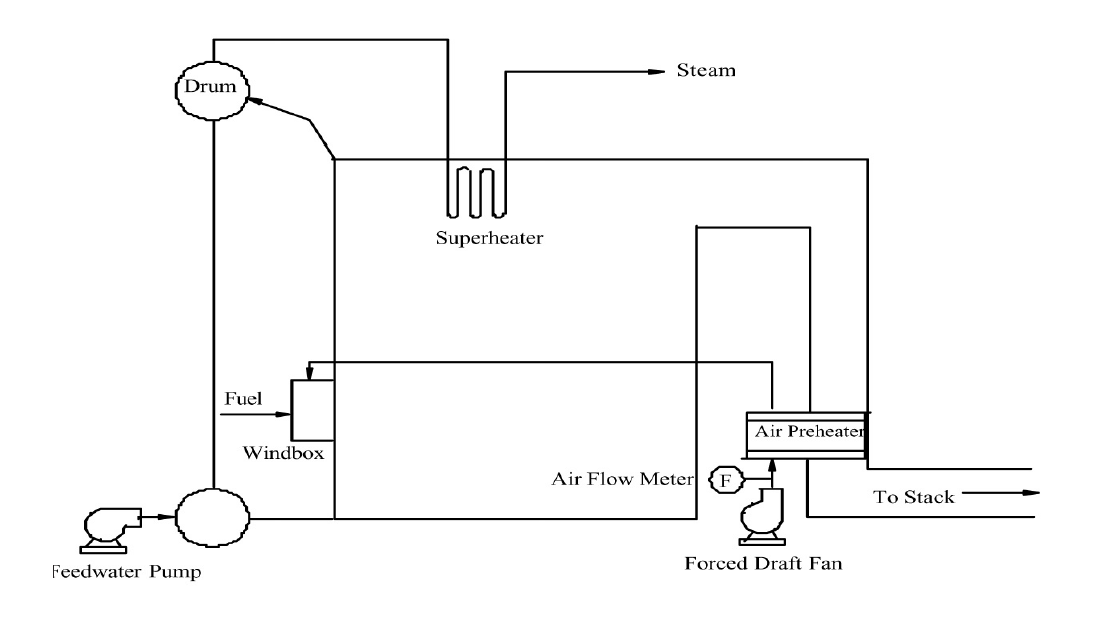
Figure 7-4. Schematic Diagram of Boiler 9
The preheater for the incoming combustion air is a Ljungstrom-type air preheater shown schematically in Figure 7-5. A heavy metal wheel rotates slowly to transfer heat from the flue gas to the incoming air. The static pressure on the incoming air side is much higher than that on the flue side. Unfortunately, this leads to significant air bypass and consumes unnecessary fan power and causes other problems. When the incoming air bypasses to the flue gas side, the flue gas temperature decreases. The lower stack temperature, due to air leakage, gives a false indication that the boiler is operating efficiently.
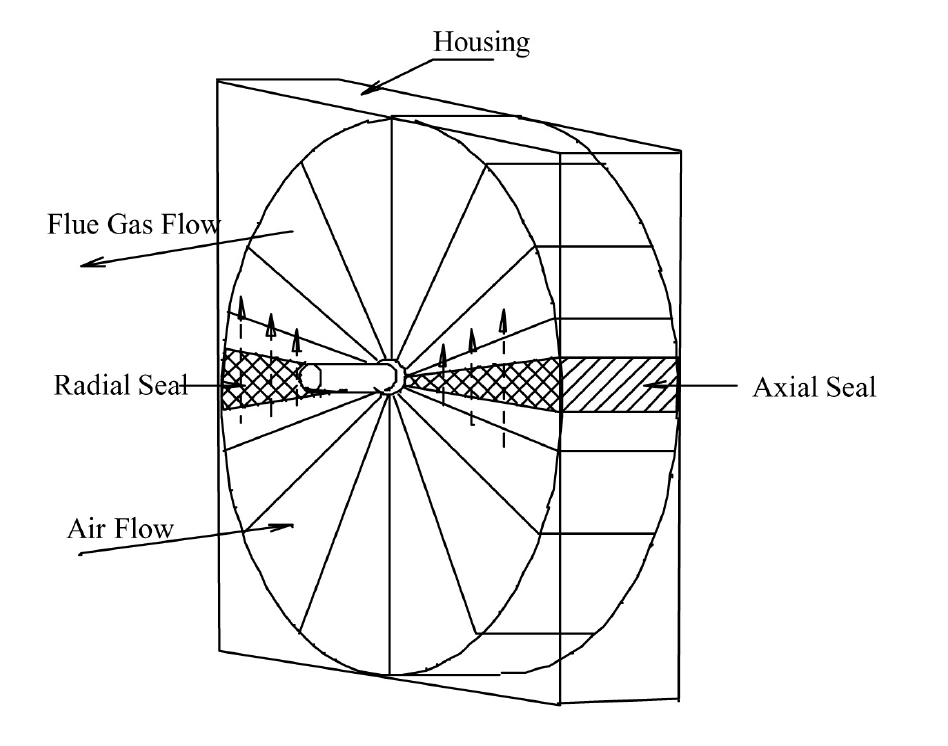
Figure 7-5. Schematic of Regenerative Air Preheater
The air leakage was determined using both O2 and CO2 measurements before and after the pre-heater. Three flue gas analyses were taken: one before the air preheater, one at the stack outlet and one right after the air preheater. The oxygen concentration was much higher following the preheater than at the stack outlet, indicating the gas sample following the preheater was not thoroughly mixed. Thus, the gas composition at the stack outlet was used to calculate the air leakage rate. The leakage rate was found to be 27% using an oxygen balance method and 29% using a carbon dioxide balance method. Table 7-2 is a summary of the gas analysis before and after the air preheater.
| – | Before air preheater | After air preheater | Ambient air | Leakage rate |
|---|---|---|---|---|
| O2 concentration | 4.6% | 8.9% | 21% | 27% |
| CO2 concentration | 9.1% | 6.5% | 0% | 29% |
If the air leakage rate was reduced from 27% to 10%, it would result in the following savings, assuming an average load ratio of 70%:
- Fan power savings: 579,000 kWh/yr or $29,000/yr at $0.05/kWh
- Thermal energy savings due to reduced air leakage: 80,700 MMBtu/yr or $202,000/yr at $2.5/MMBtu.
- Gas savings due to increased efficiency (2%): 21,000 MMBtu/yr or $52,600/yr at $2.5/MMBtu.
The total annual cost savings is $282,600/yr.
7.4 Optimize Boiler Staging
Most central plants have more than one boiler. Using optimal staging can improve plant energy efficiency and reduce maintenance cost. The optimal staging should be developed using the following guidelines:
Measure boiler efficiency. The boiler efficiency should be determined using thermal energy production, fuel consumption and fuel higher heating value (HHV). The following parameters should be measured:
Hot water or steam production (lbm/hr), m
Water enthalpy at entrance of the boiler system (Btu/lbm), h0
Water/steam enthalpy at the exit of the boiler system (Btu/lbm), he
Fuel consumption (lbm/hr), mf
\[\eta = \frac{ m ( h_0 - h_e )}{ m_f HHV}\]
If the boiler efficiency cannot be determined using this method, combustion efficiency may be used. Combustion efficiency can be determined easily using a combustion analyzer.
- Run the higher efficiency boiler as the primary system and run the lower- efficiency boiler as the backup system.
- Avoid running any boiler at a load ratio less than 40% or higher than 90%
- If two boilers are running at average load ratios less than 60%, no standby boiler is necessary. If three boilers are running at loads of less than 80%, no standby boiler is necessary.
Boiler staging involves boiler shut-off, start-up and standby. Because of the large thermal inertial and temperature changes between shut-off, standby and normal operation, precautions must be taken to prevent corrosion and expansion damage. Generally speaking, short-term (monthly) turn on/off should be avoided for steam boilers. Hot water boilers are sometimes operated to provide water temperatures as low as 80°F. This improves distribution efficiency, but may lead to acid condensate in the flue. The hot water temperature must be kept high enough to prevent this condensation.
7.5 Improve Multiple Heat Exchanger Operation
Heat exchangers are often used in central plants or buildings to convert steam to hot water or high temperature hot water to lower temperature hot water. If more than one heat exchanger is installed, use as many heat exchangers as possible provided the average load ratio is 30% or higher. This approach provides the following benefits:
- Lower pumping power. For example, if two heat exchangers are used instead of one under 100% load, the pressure loss through the heat exchanger system will be decreased by 75%. The pumping power will also be decreased by 75%.
- Lower leaving temperature on the heat source. The condensate should be super-cooled when the heat exchangers are operated at low load ratio. The exit hot water temperature will be lower than the design value under the partial load condition. This will result in less water or steam flow and more energy extracted from each pound of water or steam. For example, the condensate water may be sub-cooled from 215°F to 150°F under a low heat exchanger load. Compared with leaving the heat exchanger at 215°F, each pound of steam delivers 65 Btu more thermal energy to the heat exchanger.
Using more heat exchangers will result in more heat loss. If the load ratio is higher than 30%, the benefits mentioned above normally outweigh the heat loss. More information can be found in “System Optimization Saves $195,000/yr in a New Facility” [Liu et al. 1998].
7.6 Maintain Good Operating Practices
Central plant operation involves energy efficiency and safety issues. Proper safety and maintenance guidelines should be followed. The following maintenance issues should be carefully addressed:
- Blowdown: Check blowdown setup if a boiler is operating at partial load most of the time. The purpose of blowdown is to remove the mineral deposits in the drum. The mineral deposit is proportional to the make-up water which is then proportional to the steam or hot water production. The blowdown can often be set back significantly. If the load ratio is 40% or higher, the blowdown can be reset proportional to the load ratio. If the load ratio is less than 40%, keep the blowdown rate at 40% of the design blowdown rate.
- Steam traps: Check steam traps frequently. Steam traps still have a tendency to fail, and leakage costs can be significant. A steam trap maintenance program is recommended. Consult the manufacturer and other manuals for proper procedures and methods.
- Condensate return: Inspect the condensate return frequently. Ensure as much condensate is returned as possible. This is very expensive water. It has high energy content and is treated water. When condensate is lost, make-up water, chemicals, fuel, and in some cases sewage costs, must be paid.
References
Liu, M., Y. Zhu and D. E. Claridge, 1997. “Use of EMCS Recorded Data to Identify Potential Savings Due to Improved HVAC Operations and Maintenance,” ASHRAE Transactions-Research, Volume 103, Part 2, pp. 122-129.
Liu, M., Y. Zhu, T. Powell and D.E. Claridge, 1998. “System Optimization Saves $195,000/yr. in a New Medical Facility,” Proceedings of the 6th National Conference on Building Commissioning, Lake Buena Vista, Fla., May 18-20, pp. 14.2.1-14.2.11.
Wei, G., M. Liu and D. E. Claridge, 2001. “In-situ Calibration of Boiler Instrumentation Using Analytical Redundancy,” International Journal of Energy Research, Vol. 25, pp. 375-387.