Ch 2: Benefits of Continuous Commissioning SM
The term Continuous Commissioning (CC SM) was first used by engineers at the Texas Engineering Experiment Station’s Energy Systems Lab (ESL) at Texas A&M University to describe an ongoing process that improves building operation using measured hourly energy use and environmental data. The first buildings to undergo a Continuous CommissioningSM process were in the Texas LoanSTAR program [Liu, et al, 1994, Claridge, et al, 1994]. [1] These buildings were retrofitted with various energy efficiency improvements; measured hourly data were available to verify that the retrofits were performing as desired and analyze the overall building performance. The ESL engineers applied the CC SM process to LoanSTAR buildings where it resolved major comfort complaints and decreased whole building energy consumption by another 15% to 30% [Gregerson, 1997]. The ESL engineers quickly applied the CC SM process to other types of buildings, and the results were comparable in savings and comfort improvements.
In this chapter, the economics and other benefits of the CC SM process are discussed based on the experience gained from implementing the process in more than 130 buildings. Actual cost and savings data are provided and a detailed example is presented.
2.1 Economics of CC SM
The energy savings and costs are well documented in more than 130 buildings commissioned by the ESL. CC SM costs consist of commissioning labor costs, metering costs, and energy savings determination and reporting costs. Note that the costs of replacing broken or damaged parts are generally covered by the maintenance budget and have not been charged to the CC SM effort. The energy savings are normally determined using measured hourly energy consumption data. No credit is given to productivity increases by occupants as a result of improved comfort and lower absenteeism because of lack of documentation of this benefit. Credible anecdotal evidence, however, suggests that occupant productivity can increase substantially when facility IAQ and comfort improve.
The costs are tracked using actual labor costs. Table 2-1 summarizes the commissioning labor for Phase 2 and energy savings for 28 of the commissioned buildings. This table shows the annual savings, the cost of the CC SM labor (if the combined time cost of CC SM engineers and technicians is charged at $100/hour) and the simple payback.
It should be noted that these costs represent the initial commissioning effort. They do not include metering and reporting costs or cost of the time devoted to the effort by building facility staff. Nor do they include follow-up labor costs to find and fix problems related to subsequent component failures or other problems. The simple payback varies from 0.3 years to 2.0 years. The cost of metering is discussed in detail later in the chapter.
| Building Type | Number of Buildings |
Savings | Labor Cost | Simple Payback |
|---|---|---|---|---|
| $/1000ft2/yr | $/1000ft2/yr | Years | ||
| Hospitals | 6 | 430 | 474 | 1.1 |
| Laboratory/Offices | 7 | 1260 | 368 | 0.3 |
| Classroom/Offices | 5 | 430 | 226 | 0.5 |
| Offices | 8 | 220 | 329 | 1.5 |
| Schools | 2 | 170 | 336 | 2.0 |
| Averages/Total | 28 | 540 | 359 | 0.7 |
Table 2-2 provides more-detailed information on the initial commissioning labor costs and energy savings for each of the 28 commissioned buildings. It provides information on building type, location, floor area, measured annual savings, savings per square foot of floor area, commissioning labor and the year initial commissioning was completed. The measured annual savings varied from $10,000/yr to $395,000/yr with an average of $90,000, or $0.64/ft2/yr for the 28 buildings. The measured savings per square foot were strongly dependent on the building type. Average savings were $1.26/ft2/yr for seven medical research laboratory buildings, $0.43/ft2/yr for six hospitals, $0.43/ft2/yr for five university teaching and office buildings, $0.22/ft2/yr for seven office buildings and $0.17/ft2/yr for two school buildings. It should be noted, however, that the variation between buildings within a single category is often as great as the variation between building types.
The CC SM costs are strongly dependent on the building type and building condition, HVAC system type and size, HVAC system condition and the type and condition of the building automation system. Generally speaking, higher CC SM costs are directly associated with more existing mechanical and comfort problems, more complex system types, smaller HVAC system sizes, poorly maintained systems and old building automation systems. The CC SM cost per unit floor area for particular office buildings may be higher than the cost of some hospitals or laboratory buildings due to old building automation systems (See Table 2-2 for details). The labor cost is a complex matrix of the factors mentioned above. The cost of implementing CC SM must be determined case by case, based on individual building information.
The commissioning effort in these buildings focused strongly on resolving known comfort problems and optimizing energy use in the buildings. In some cases, building owners asked that the commissioning engineers go through the buildings and examine the operation and control of all parts of the system to specifically identify and replace any malfunctioning components in addition to dealing with known comfort problems. In these cases, the labor costs are significantly higher. These problems must be addressed before complete operational savings potential can be realized.
| Approach | Metering Cost | Reporting Cost | Total Cost |
|---|---|---|---|
Metering is important to develop energy baselines, evaluate CC SM energy savings and identify operation and control problems. The parameters metered vary with the type of metering used. Use of utility bills requires both monthly electrical and gas bills. Use of short-term monitored data requires hourly chilled water energy or chiller electricity, heating water energy or gas consumption, possibly whole building electricity consumption, and/or electricity consumption of selected end uses such as fan motors.
Use of long-term hourly data requires chilled water energy or chiller electricity, hot water/steam energy or gas consumption and building electricity consumption. Lighting and motor control center electricity may be sub-metered in some cases. However, the additional costs of metering the lighting and motor control center electricity limit access to this data.
Metering costs depend on the type of metering used: utility bills, short-term monitoring with dedicated meters, long-term monitoring with existing meters or long- term monitoring with dedicated meters. The reporting cost also often correlates with the type of metering used. Table 2-3 lists the average metering and reporting costs for a typical building. Although costs will vary greatly depending on the complexity of the building and the location of the building, the average cost of metering and reporting varies from $1,500 to $20,500. Some methods may not be suitable for a particular project due to specific accuracy requirements. In addition, use of utility billing data (see chapter 1) will not provide diagnostic benefits for follow-up services. The type of metering should be selected based on the interests of the owner, potential savings opportunities, and the overall CC SM plan.
| Approach | Metering Cost | Reporting Cost | Total Cost |
|---|---|---|---|
| Utility Bills | $1500 | $1500 | |
Short Term dedicated Meters |
$5000 | $5000 | $10000 |
Long Term with Existing Meters |
$4000 | $3500 | $7500 |
Long Term with Dedicated Meters |
$17000 | $3500 | $20500 |
If the savings are determined from the utility bills before and after Continuous CommissioningSM, there is no metering cost. The staff may directly compare similar months of utility bills before and after CC SM. This is the least-accurate approach and should not be used unless it can be shown that the facility energy use is independent of weather, has the same occupancy level before and after CC SM, uses the same operational schedule before and after CC SM and the expected savings are greater than 15% of the total energy consumption. If a more formal comparison is done that considers billing period length, corrects for weather variations and provides a formal report, a typical cost would be $1,500.
When portable meters or loggers are used to measure whole-building electricity, chilled water, and hot water consumption for a short time period (one or two weeks), the cost varies from $3,000 to $10,000 with a typical cost of $5,000. This cost includes labor and travel (2 trips) to the building, meter hook-up, recording data for two weeks and the associated meter rental.
When short-term data are used to determine annual savings, a simplified hourly simulation model must be calibrated to the short-term data and a longer period of utility billing data. The modeling effort varies greatly according to available data, building type and size, and HVAC system and operational schedules. This cost can vary from $3,000 to $10,000 per building, but is typically $5,000.
When an EMCS is used to measure whole building electricity, chilled water, and hot water consumption with existing meters, the cost may vary from essentially zero (if all sensors are already present) to $20,000 or more if a complete set of new sensors and channels must be added to the system to record heating, cooling and other energy use. The cost of $4,000 shown in the table assumes that a minimal amount of new equipment is needed and that existing equipment is calibrated. New meters with dedicated data loggers can be installed to measure whole building heating, cooling and electricity use. The cooling use may come from metering the chiller and associated parasitic electricity use, or metering chilled water energy consumption. Likewise, heating consumption may come from metering heating water energy consumption or boiler gas consumption. The metering cost may be below $10,000 when only whole-building electricity and gas consumption are measured. Note that gas is typically measured by adding a signal splitter to the existing gas meters due to the higher cost associated with installing a dedicated gas meter. The metering cost is approximately $15,000 for a building where chilled water and hot water are to be measured. When there are multiple transformers, metering costs can easily exceed $20,000 including data acquisition and analysis.
When hourly data are available, a statistical regression model can be used to determine the savings accurately. The cost varies from $3,000 to $4,000 per building. This cost includes the baseline model development, database management, savings analysis and reporting. The metering cost is likely to decrease as more meters are installed as part of building automation systems. When existing meters are used, sensor calibration should be conducted first to verify the sensor accuracy and operating range. For example, a differential pressure transmitter with a 100 in H2O range may be used to transfer a signal with a maximum value of 10 in H2O. In this case, the sensor should be replaced due to a mismatch of the signal range with the sensor range.
2.2 Benefits of CC SM
The CC SM process uniquely combines four features that make it an attractive engineering process. These four features are (1) sustainable engineering solutions to operational problems, (2) superior energy and comfort performance, (3) increased staff skills and (4) service as an enabling factor for a comprehensive facility overhaul. Each feature is discussed below and examples are given.
2.2.1 Sustainable Engineering Solutions for Operational Problems
Sustainable engineering solutions are often not used to solve existing operational and comfort problems in buildings. Part of the reason is a lack of understanding of the problems and a lack of engineering knowledge by some facility operations staff. During the CC SM process, a thorough engineering inspection is conducted and measurements are made. Sustainable engineering solutions based on fundamental engineering principles are developed and implemented. This will generally solve the existing problems and decrease the maintenance cost.
CASE STUDY EXAMPLE:
Four large hearing rooms in a new state building could not maintain room temperature at the required set point (72°F) when a large number of people used the facility. In an attempt to resolve the problem, users of the facility were required to inform the operating staff 24 hours before each scheduled use. The operating staff then precooled the room temperature to temperatures as low as 66°F before a meeting. The room temperature could then be maintained below 74°F if the meeting lasted less than three hours. However, cold complaints often occurred at the beginning of the meetings and hot complaints occurred later, particularly in longer meetings.
After a thorough analysis, the CC SM engineers developed the following solutions. The supply air static pressure and temperature were reset based on the maximum terminal box damper position. If the maximum terminal damper position is less than 80% open, the supply air temperature is reset to a higher value but should not exceed the high limit determined by the room relative humidity requirement. The static pressure set point is decreased but may not decrease below a low limit setpoint. If the maximum terminal box damper position is more than 80% open, the supply air temperature is reset to a lower value and the static pressure is reset to a higher value. The room temperature set point remains at 72°F. Since the building has a modern EMCS, this type of sophisticated control and schedule were easily implemented by building operators. This control schedule provides more than the design cooling capacity to the hearing room when it is required. The “additional capacities” come from the system diversity. When a hearing room required maximum cooling, other rooms served by the same unit had less than the design cooling load. This improved schedule made the occupants more comfortable, decreased energy consumption and reduced complaints for the operating staff .
2.2.2 Superior Energy and Comfort Performance
Design engineers face uncertainties in building design because they lack knowledge of actual occupancy levels and construction quality. To insure a workable building, HVAC systems are often designed with more capacity than required. Conservative
operation and control schedules are recommended. The HVAC engineers often pay little attention to part-load control and operation. Consequently, working as designed, a system may have poor energy performance. In addition, an excessively large system often creates comfort problems since it may not control well under very low load conditions.
During the CC SM process, accurate occupancy and operational information are available. The CC SM engineers can develop an improved or practical optimal operation and control schedule based on the information gathered during the CC SM assessment. Moreover, the CC SM engineers can fine-tune their schedules to ensure the best performance. Implementing the CC SM process often results in additional energy savings for both retrofit projects and new construction projects [Claridge et al. 1996, Liu et al. 1998].
CASE STUDY EXAMPLE:
Figure 2-1 compares the annual energy costs before retrofit, after retrofit and after CC SM in three major medical facilities. The measured savings from CC SM are higher than the retrofit savings in two of the facilities and slightly less than the retrofit savings in the third facility. The CC SM costs were a small fraction of the retrofit (capital) costs. The equipment replaced or upgraded was important to these facilities. However, in each of these three cases the retrofits were considered “completed” even though significant savings ($2,471,000/yr) resulted from commissioning of the retrofits and the facilities.
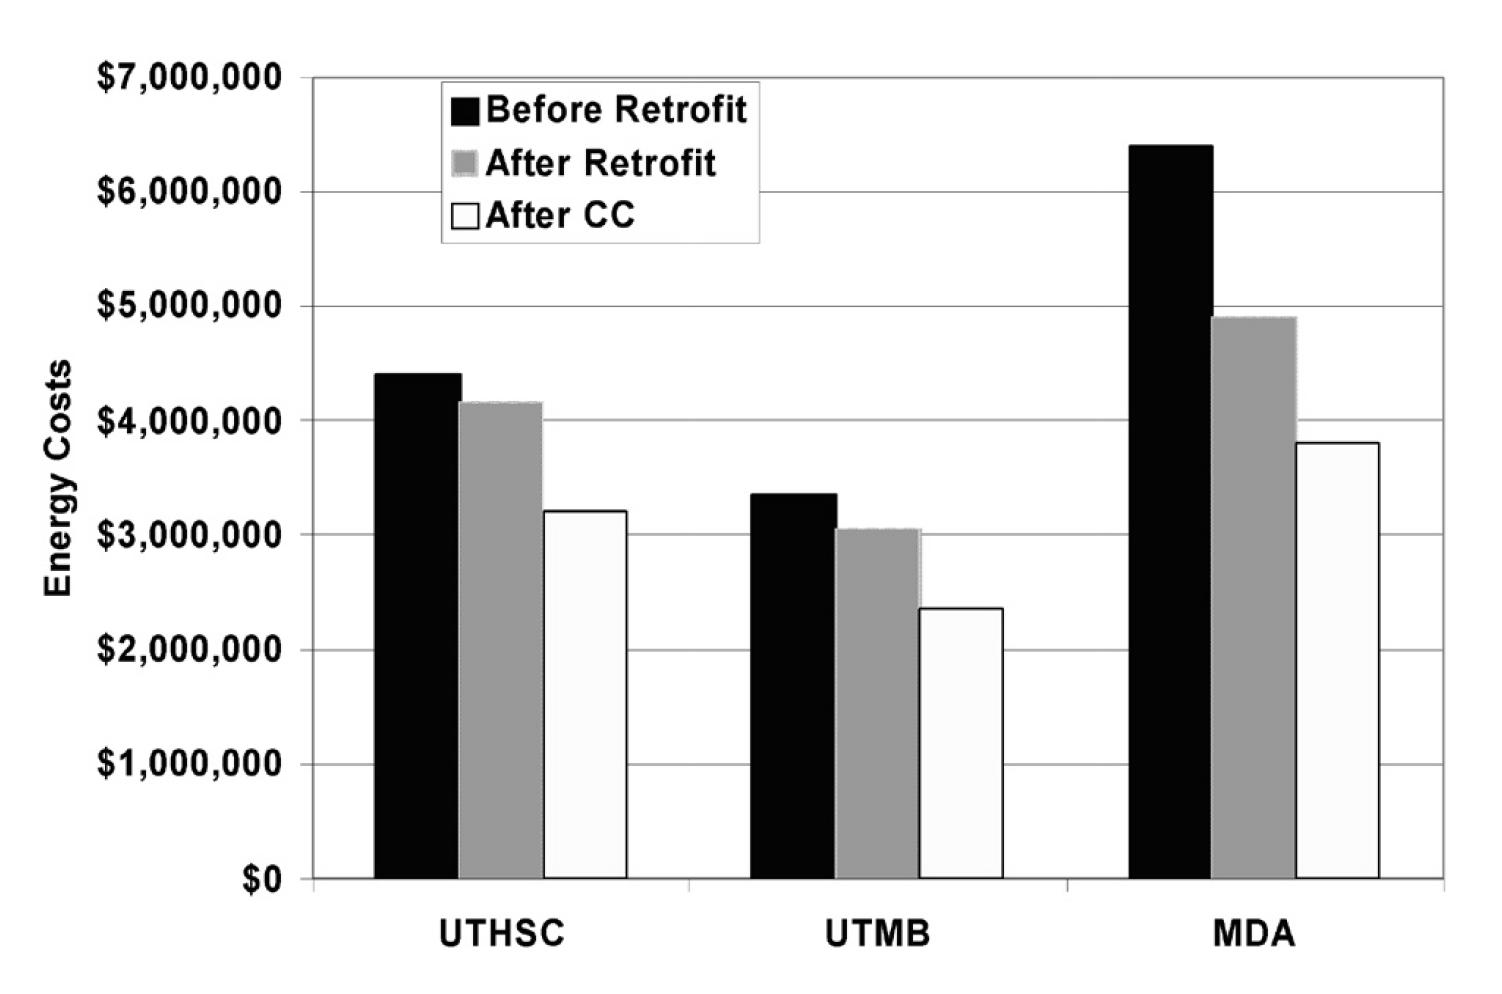
Figure 2-1. Energy Costs Before Retrofit, After Retrofit, and After Retrofit and CC SM at University of Texas, Health Science Center (UTHSC), University of Texas Medical Branch at Galveston (UTMB), University of Texas, M. D. Anderson Cancer Center (MDA)
2.2.3 Increased Staff Skills
During the CC SM process, the CC SM engineers work closely with the building staff to identify operating problems and determine optimal operating strategies. The staff is also heavily involved in the decisions to implement specific commissioning measures and may actually implement these measures. Hence, they gain a higher level of skill and understanding of the engineering principles involved in optimal building operation. In addition, the staff may attend a training workshop as part of the CC SM process as was done at the Fairview University Medical Center in the case study described later.
2.2.4 An Enabling Factor for Comprehensive System Overhaul
A comprehensive system overhaul or major system upgrade is often delayed or canceled due to lack of funding. This problem can be resolved if savings from the CC SM process are used to fund the upgrade project.
The CC SM process requires minimal initial investment and produces significant energy savings as soon as the process starts. Positive cash flow is often achieved in less than two years. This creates the opportunity to use utility savings to support major retrofit projects. The CC SM process can have another significant impact on retrofit projects. It reduces the audit and engineering analysis cost since major cost-effective measures are normally identified during the CC SM process. It also decreases the risk of engineering mistakes during retrofits since the commissioning process results in an excellent understanding of the characteristics and operation of the existing systems. Consequently, retrofit costs can be controlled to a minimum.
CASE STUDY EXAMPLE:
Texas A&M University initiated campus-wide CC SM in 1995. A comprehensive energy information system was installed in 80 major buildings and five central plants at a total cost of nearly $1,000,000. The CC SM started in May 1996 after energy baselines were established for several buildings. The annual budget since 1996 for CC SM, data acquisition, and reporting is approximately $600,000. Figure 2-2 presents the accumulated savings, cost, and net cash flow from May 1995 to May 2001. Positive cash flow was achieved in approximately two years. In smaller projects, positive cash flow has often been achieved in less than one year.
The positive results of the CC SM project accelerated the process of upgrading the campus EMCS systems. Since 1996, central EMCS systems have been installed in 45 buildings and nine pumping facilities.
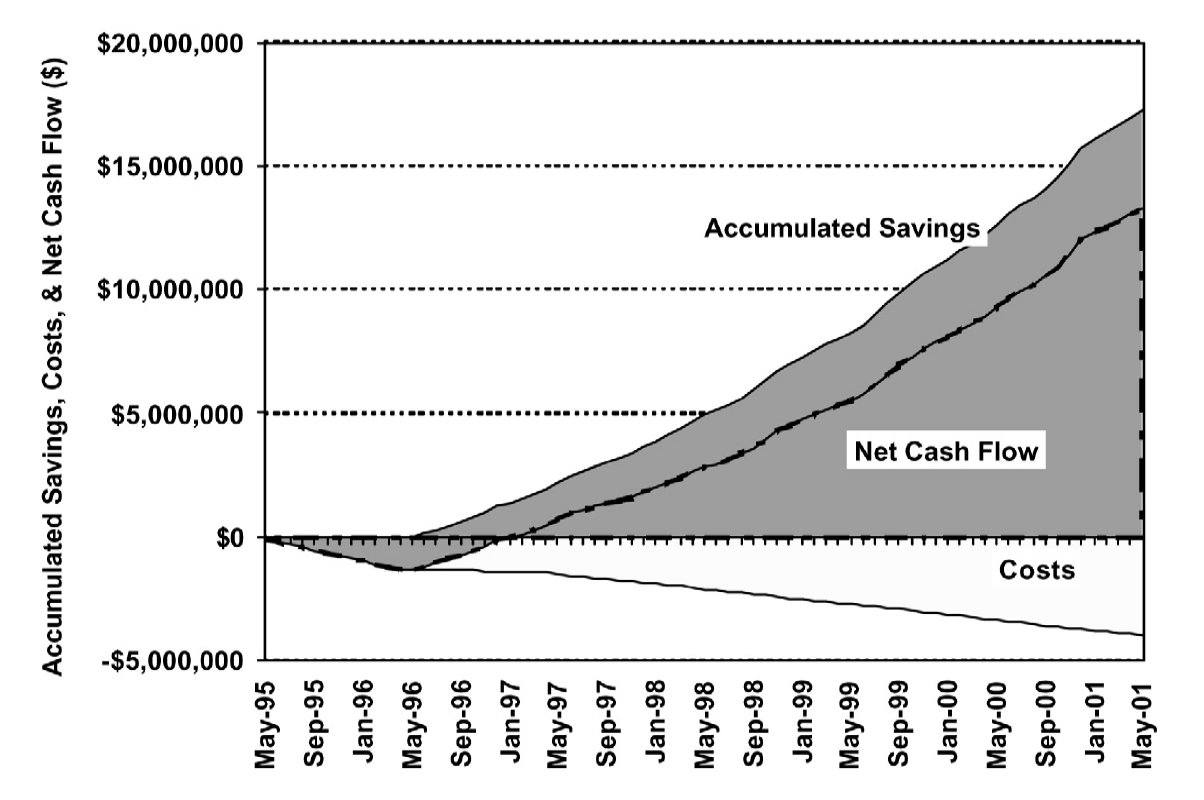
Figure 2-2. Accumulated Project Cost, Energy Cost Savings and Positive Cash Flow at Texas A&M University, College Station Campus
2.3 CC SM Project Example
Riverside North is an extended-care mental health facility built in 1962 as one of the Fairview University Medical Center hospitals in Minneapolis, Minnesota. The gross floor area is approximately 37,300 sq. ft. on four floors, excluding the basement. The building receives steam from a district steam plant and chilled water from a central campus plant. Two major air-handling units (AHUs) serve the entire building with induction terminal units. The AHUs each have 20 hp. supply fans and 10 hp. return fans operated at a constant speed 24 hours per day. Hot water supplied by steam to hot water converters is circulated to reheat coils and supplemental perimeter radiation by four 7.5 hp. pumps. The supplemental perimeter radiation system was turned on manually at outdoor temperatures below approximately 10°F and was automatically reset over a range of 120°F to 180°F when the outside air temperature varied from 10°F to -20°F. Chilled water is circulated through the building by a 10 hp. pump with a variable frequency drive located in the basement. The building has unitary controllers and a supervisory control building automation system.
The CC SM engineers were responsible for training technicians, identifying CC SM measures, conducting the engineering analysis and supervising in-house technicians during the field measurement and implementation phases. As part of the training, a two-day workshop was provided to participating technicians and other key facility staff. The CC SM engineers participated in the initial field measurement process since the building is relatively small.
After the engineering analysis, six CC SM measures summarized in Table 2-4 were identified.
| Measure and Details |
|---|
|
At the owner’s request, a new unitary Trane controller replaced the existing pneumatic controller. All existing sensors of the AHU systems also were replaced with new ones. The energy savings were determined using short-term measured data. Figure 2-3 compares the measured heating energy consumption before and after CC SM measures were implemented. A significant reduction in cooling energy use was also achieved as noted in Table 2-5.
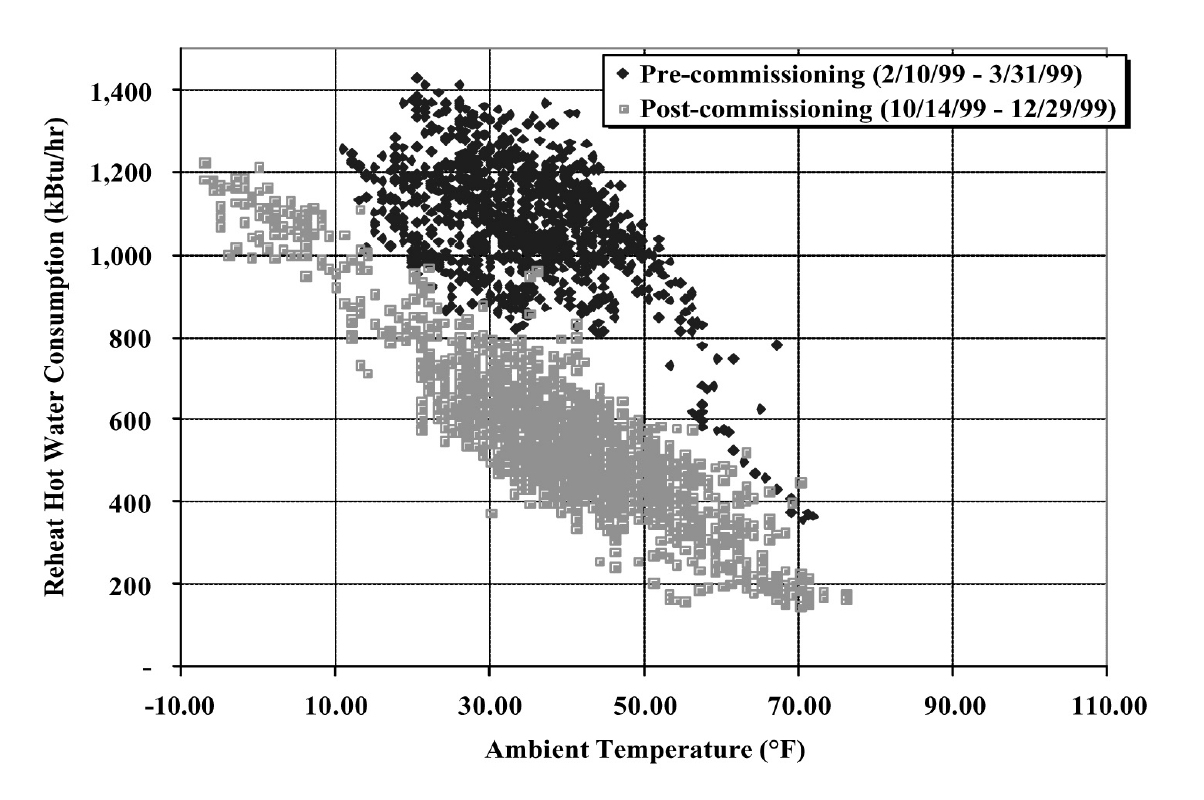
Figure 2-3. Hourly Reheat Energy at Riverside North (15-minute data)
Table 2-5 summarizes the measured energy cost savings, cost and payback. The measured annual energy cost savings are $45,512 including $10,906 for fan power, $5,700 for chiller power, $65 for radiation pump and $28,841 for heating. The total project costs were $40,146 including $10,850 for controller and sensors, $19,296 for CC SM engineers and approximately $10,000 for in-house labor for technician participation in training, field measurement and implementation. The simple payback was 0.9 years.
| Savings | |||||
| END USE | Source | Electricity | Demand | Steam | Dollars |
| kWh/y | kW/mo | MMBTU | $ | ||
| Fan | Measured True Power Pre - Post |
218,124 | 24.9 | – | 10,906 |
| Chiller | Modeled based on SA rate and SAT |
114,000 | 33.4 | – | 5,700 |
| Radiation Pump | Estimated | 1,300 | – | 65 | |
| Reheat | Measured energy bin analysis |
3,770 | 28,841 | ||
| Total | 333,424 | 58.3 | 3,770 | 45,512 | |
| Costs | |||||
Equipment&materials (Trane Controller and a few sensors) |
10,850 | ||||
| Engineering | 19,296 | ||||
| In-house labor | 10,000 | ||||
| Total | 401,46 | ||||
2.4 Summary
The Continuous CommissioningSM process typically provides payback in less than three years and often in less than two years. Project duration typically varies from three to six months per building.
The CC SM process improves building comfort and decreases maintenance cost. It also provides significant benefits to the owners by (1) identifying potential energy retrofits, (2) upgrading the technical level of in-house staff and (3) providing energy savings that may be used to finance a comprehensive facility overhaul or upgrade.
References
Claridge, D.E., J.S. Haberl, M. Liu, J. Houcek and A. Athar, 1994. “Can You Achieve 150% of Predicted Retrofit Savings: Is It Time for Recommissioning?” ACEEE 1994 Summer Study on Energy Efficiency In Buildings Proceedings: Commissioning, Operation and Maintenance, Vol. 5, American Council for an Energy Efficient Economy, Washington, D.C., pp. 73-87.
Claridge, D.E., M. Liu, Y. Zhu, M. Abbas, A. Athar and J.S. Haberl, 1996. “Implementation of Continuous CommissioningSM in the Texas LoanSTAR Program: Can You Achieve 150% of Estimated Retrofit Savings Revisited,” Proceedings 4, Commercial Buildings: Technologies, Design, and Performance Analysis. ACEEE 1996 Summer Study on Energy Efficiency In Buildings, American Council for an Energy Efficient Economy, Washington, D.C., pp. 4.59-4.67.
Gregerson, Joan, 1997. “Cost Effectiveness of Commissioning 44 Existing Buildings,” Proceedings Fifth National Conference on Building Commissioning, Huntington Beach, CA April 28-30.
Liu, M., A. Athar, D.E. Claridge, J. S. Haberl and E. White, 1994a. “Reducing Building Energy Costs Using Optimized Operation Strategies for Constant Volume Air Handling Systems,” Proceedings of the Ninth Symposium on Improving Building Systems in Hot and Humid Climates, Arlington, Texas, May 19-20, pp. 192-204.
Liu, M., J. Houcek, A. Athar, A. Reddy and D.E. Claridge, 1994b. “Identifying and Implementing Improved Operation and Maintenance Measures in Texas LoanSTAR Buildings,” ACEEE 1994 Summer Study on Energy Efficiency In Buildings Proceedings: Commissioning, Operation and Maintenance, Vol. 5, American Council for an Energy Efficient Economy, Washington, D.C., pp. 153-165.
Liu, M., Y. Zhu, T. Powell and D.E. Claridge, 1998. “System Optimization Saves $195,000/yr. in a New Medical Facility,” Proceedings of the 6th National Conference on Building Commissioning, Lake Buena Vista, FL, May 18-20, pp. 14.2.1-14.2.11.
Footnotes
| [1] | LoanSTAR is an acronym for Loans to Save Taxes and Resources, a major public building retrofit program administered by the Texas State Energy Conservation Office. |